For the preparation of the study, a series of technical studies were carried out using the latest available technologies to evaluate the current situation of the section with respect to the objectives set.
Digital terrain model
The first step is the development of a digital terrain model (called a DTM) that reproduces the current situation (the equivalent of a model but in a digital environment). It is important that the digital model faithfully reproduces the conditioning factors of the river section under analysis, for which the following work is carried out.
First, the terrain is reproduced on a large scale, using LIDAR (Light Detection and Ranging or Laser Imaging Detection and Ranging) topography, which consists of scanning the terrain using aerial means (normally a light aircraft is used for large areas, but drones are commonly used). This scanner obtains digital reproductions of the terrain with an accuracy of 20 centimeters in plan and 15 centimeters in height, which are treated in the office to eliminate vegetation and other elements not useful in the study (electrical networks, automobiles, people, animals, etc.) obtaining a reproduction of the ground.
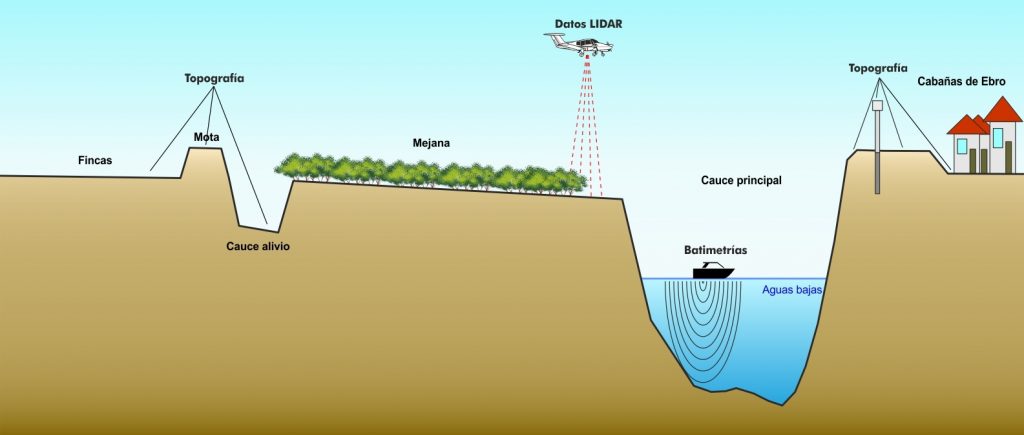
Diagram of the data collection process (own elaboration)
Next, the topography of the most important elements for the study is obtained, such as: the crown of the dikes, walls, breakwaters, bridges, drains, relief channels, safety perimeters, roads, etc. This work has been carried out using classical surveying methods. Combining LIDAR data with topographic data reduces the overall error.
The above methods have the disadvantage that they are not able to obtain data from the ground beneath the water. This has been the main drawback encountered in previous flood studies. Technology is now available to obtain the topography of the river bed in a continuous manner. As a novelty for these studies carried out within the framework of the Ebro Resilience Strategy, aquatic means equipped with sonar have been used to collect topographic data of the riverbed (bathymetry), incorporating these data into the study.
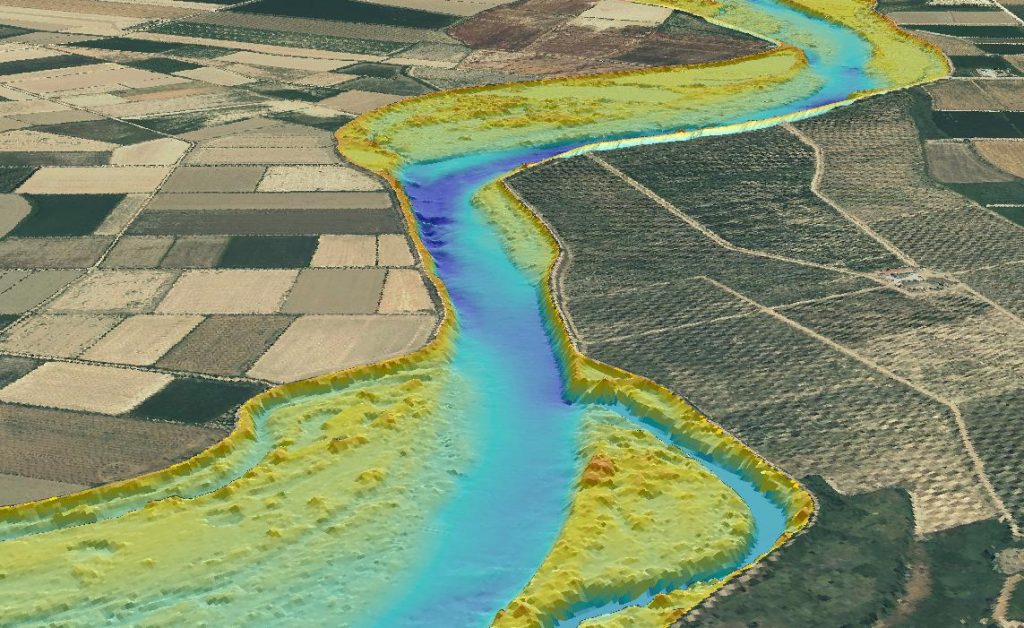
Visualization of the high-resolution bathymetry developed for section 12 (own elaboration).
With all this combined information, the digital terrain model (DTM) is elaborated. DTMs make it possible to analyze the possible morphological imbalances of the section under study and to objectively determine the areas of the riverbed where erosion and sedimentation processes occur.
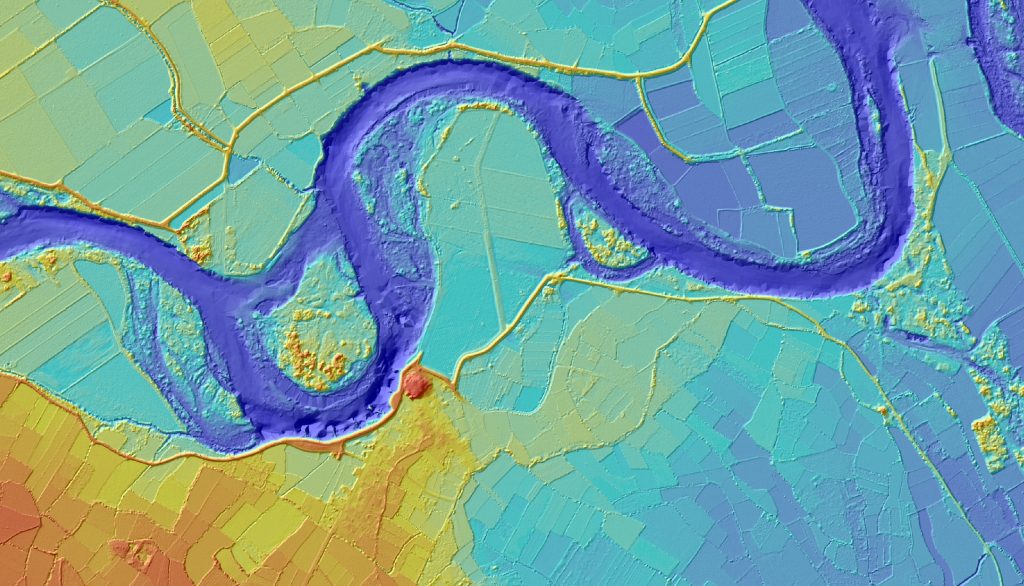
Fragment of the digital terrain model of section 7 (prepared by the company).
Hydraulic model
The next step of the study is the analysis of flooding episodes. To carry out this work, hydraulic models are used, which consist of a computer tool that applies a given flow rate to the DTM and reproduces the effects of the flood, determining the magnitude of the flood and providing the height and velocity that the sheet of water would reach at each point of the terrain. It would be the equivalent of pouring water into our model.
These computer tools require a process called calibration to adjust the results obtained to the characteristics of the section under study. In this case, the floods of April 2018 and December 2019 have been reproduced in the computer tool and by comparing the results obtained with the aerial photos of these floods, the parameters of the hydraulic model are adjusted, so that the flood spots in reality and in the simulation coincide sensibly.
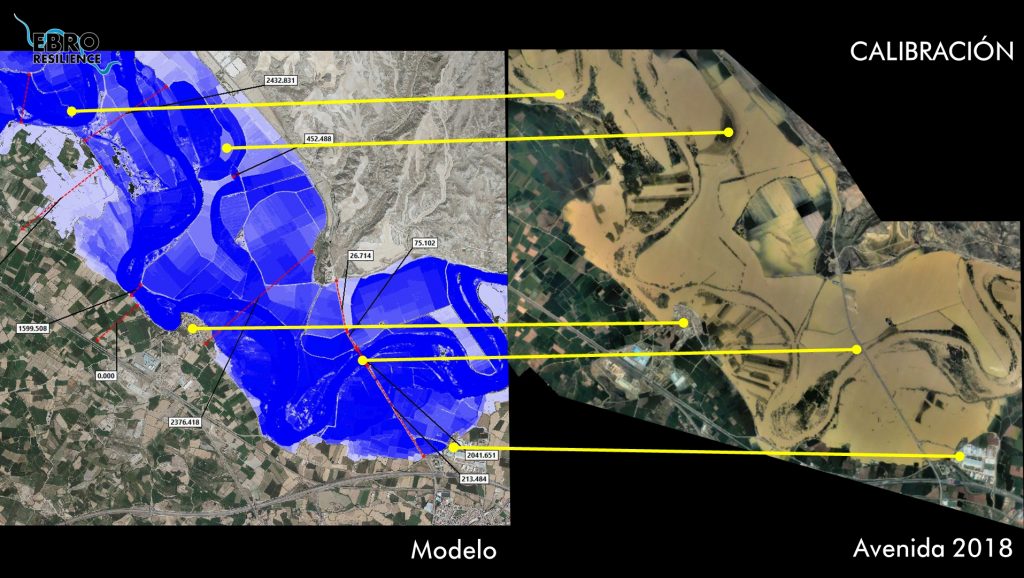
Calibration of the hydraulic model with the 2018 flood for section 8 (own elaboration).
Once the hydraulic model has been configured and calibrated, the target flood is reproduced, in this case the one corresponding to a return period of 25 years in urban areas and the 10-year return period flood for non-urban areas.
The results of the hydraulic model make it possible to analyze the way in which flooding occurs, determine the points of overflow, indicate the points of the defenses that suffer the greatest stress and show the path of the waters once they have overflowed, among other factors.
These models also have their limits. They consider the terrain to be rigid and, consequently, do not reproduce the breaks in the defenses when they are overflowed. Their optimum performance is in long distances and they lose precision in local phenomena. Nor can they predict random events such as falling trees, sudden breaks in defenses, open ditches, terrain alterations made after the data were taken, etc.
Overflows over the defenses of section 6 (own elaboration)
Results
Once the results of these floods have been evaluated for the current situation, different action alternatives are studied, individually and in combination, selecting those that produce the desired effects and discarding the least favorable or counterproductive ones.
For this purpose, the digital terrain model is modified to incorporate the desired performance and the design flood is reproduced again. The software determines the variations in water height and flow velocity between the current situation and the variant under analysis for each point of the model. By analyzing these parameters, it is determined whether the action improves the current situation or not and, based on this, this line of work is continued or it is necessary to open new avenues of study.
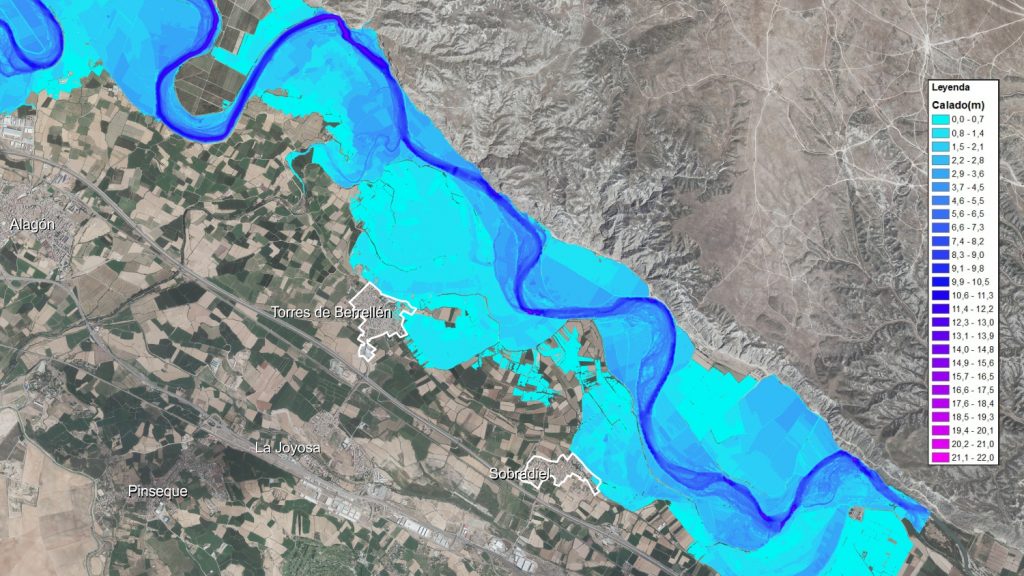
Results of the hydraulic model (draughts) for the current situation in section 9 (own elaboration)