Background and problems detected
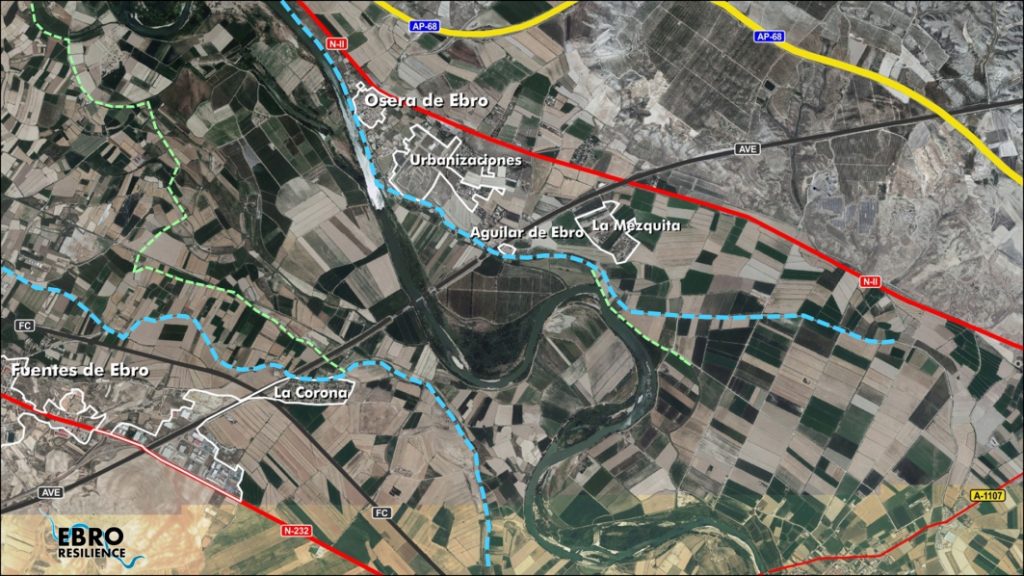
Within the scope of the Ebro Resilience Strategy, a total of 260 kilometers of the Ebro River are being studied, divided into 15 sections. Section 12 comprises the course of the Ebro River as it passes through the municipalities of Osera de Ebro, Fuentes de Ebro, Pina de Ebro and Quinto. Due to the great length of the section (24 kilometers) and the fact that there is a point where the system undergoes a modification in its hydraulic operation, at the Talavera site, it has been decided to subdivide the section into two different studies.
This document summarizes the detailed study for section 12A, which includes the Ebro River from the Mejana de las Viudas, in the municipality of Osera de Ebro, to the Talavera area, in the municipality of Fuentes de Ebro. The meander known as Deslinde, on the left bank of the Ebro and in the municipality of Pina de Ebro, which will be included in the study of section 12B, as its operation influences the town of Pina de Ebro, is not included.
This section describes the problems detected in the study section, according to what was perceived during and after the flood episodes, the experiences transmitted by the territory and the conditioning factors of any type that are located in the area of analysis.
The hydraulic behavior of the river in the section is conditioned by the existence of several fluvial terraces1 located at different elevations (Figure 1). At the beginning of the section, the river flows against the upper terrace on which Osera de Ebro sits, on the left bank. This terrace is not floodable even for high return period floods. From this point on, the river begins a straight stretch in which it can only overflow on the right bank.
The river is extensively channelized in almost all of its lower terrace limits through longitudinal levees (locally called motas). The channeling does not follow a regular pattern or design and at some points generates significant reductions in the drainage section coming from adjacent sections.
In flood episodes, the water overflows the upstream channel and there is a pronounced “dam effect2” that prevents the overflowed water from returning to the main channel. At these times, the water flowing through the cultivated area reaches speeds in some areas that cause erosion of agricultural land and breaks in the irrigation system, which is located at a higher altitude than the fields.
In turn, the narrow areas of the channel (Figure 3) cause over-elevation of the water level in the sections immediately upstream, as they are incapable of absorbing the tributary waters. At these points the levees are overtopped by the water and breakage occurs because, being made of earth materials, when they are overtopped by the water, the water erodes their backdrop3. Erosion progresses towards the inner part of the levee and usually leads to the collapse of the structure. Sudden levee breaches in these cases can cause erosion of more than 10 meters deep in the surrounding farms, accompanied by sediment input that can extend several hundred meters.
The overflowing waters that flow through the cultivated area cause breaks in the canalization through which they return uncontrollably to the main channel. These back breaks are unpredictable in terms of their spatial location and timing. This fact generates uncertainty during flood episodes in the town of Pina de Ebro, located downstream of the section under study. Inlet breaks induce sudden drops in water levels near the town of Pina and in sensitive areas for the defense of the population. In the same way, uncontrolled returns to the main channel cause sudden and unforeseen rises in water levels, which could lead to overflowing of the population’s defense dykes.
In summary, flooding in the study section generates significant economic damages after each episode. In the recent ones suffered in 2015 and 2018, repairs to the irrigation system reached a value of €1 million in each episode and repairs to the defense dykes totaled €3 million also in each episode. To these figures must be added compensation for crop losses, contributions made by private individuals and indirect losses in the production chain (transporters, warehouses, canneries, freezers, operators, etc.). In addition, the return to normality takes several months.
Background and problems detected
Once the conditions detected during the flood episodes have been exposed, it is necessary to study the possible causes of these problems, so that the intervention proposal resulting from this study focuses on the correction of the causes and not on their consequences.
Analysis of morphological variations
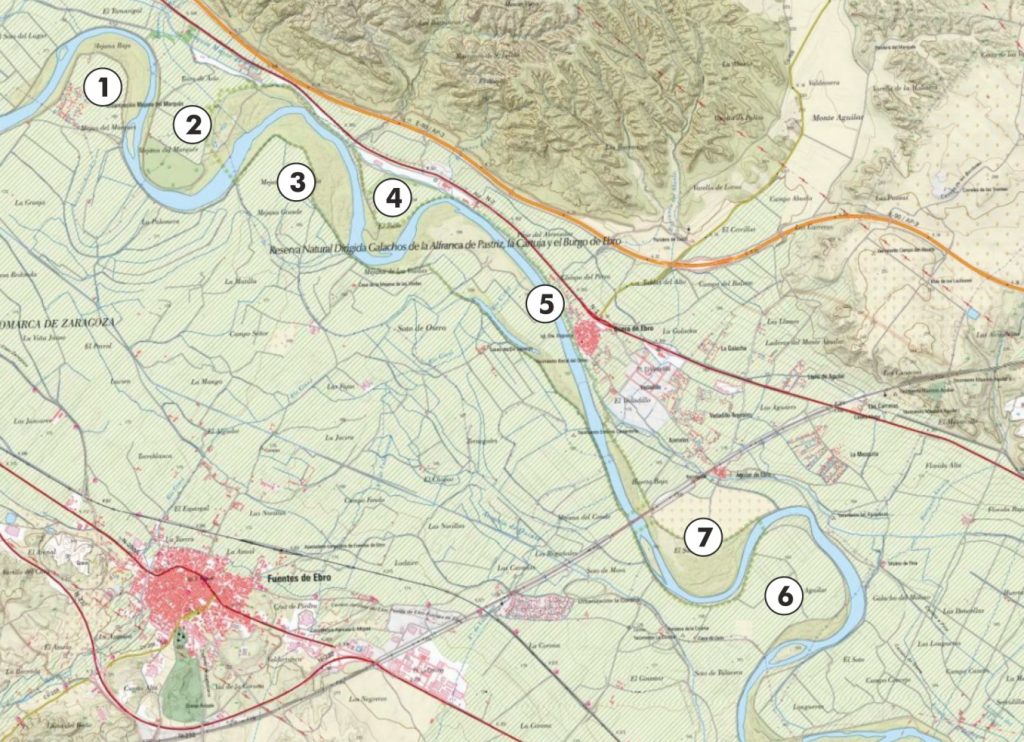
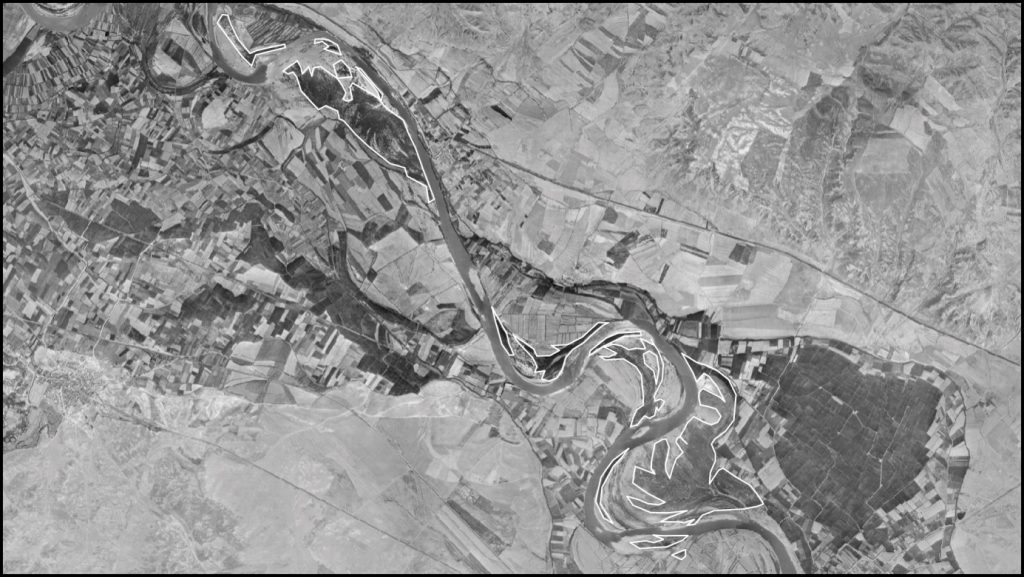
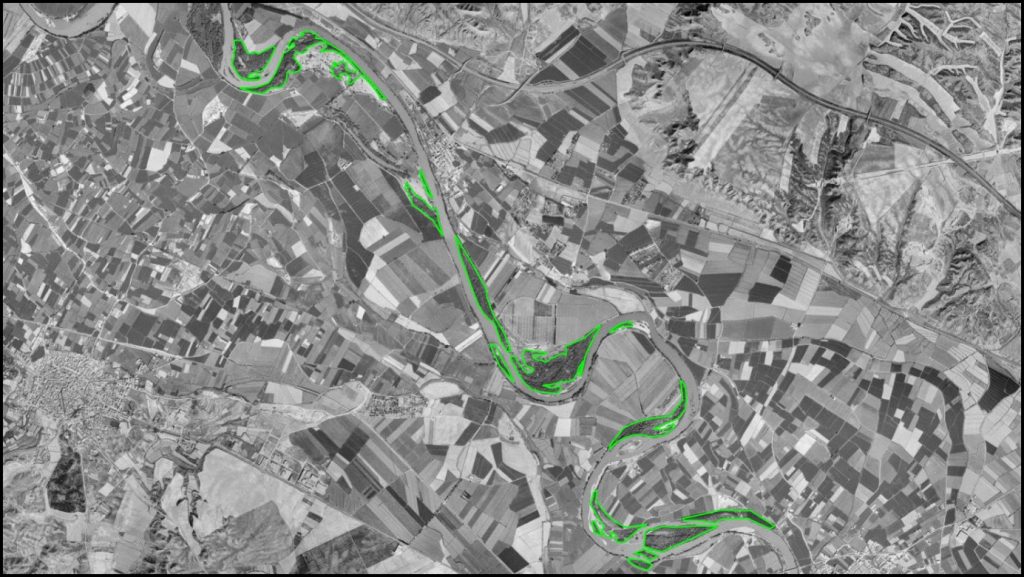
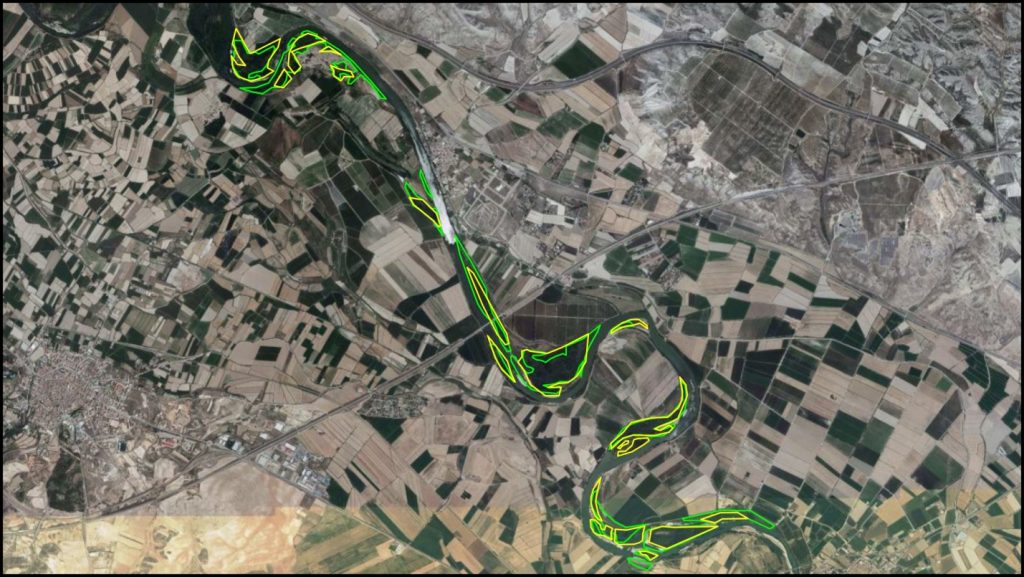
The Ebro River enters the study section after passing through four meanders: Baja mejana, mejana de El Marqués, mejana de La Sorolla and El Tollo (1 to 4 in figure 4). After circumventing the latter, the river flows against the upper terrace where the town of Osera de Ebro is located, on the left bank, and begins a large straight stretch of 4.7 km (5 in figure 4) until it reaches the Aguilar meander (6 in figure 4), on the right bank, and the Aguilar meander (7 in figure 4), on the left bank. From this point on, the riverbed once again meanders and enters the municipality of Pina de Ebro, now outside the study. As it flows through the described route, the river approaches and moves away from the upper river terraces, which are at a higher elevation.
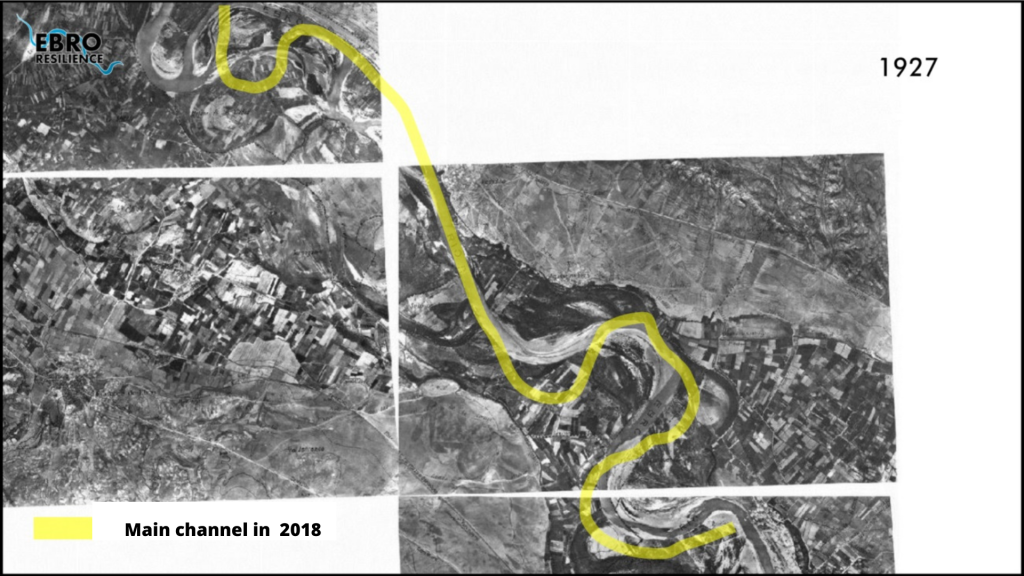
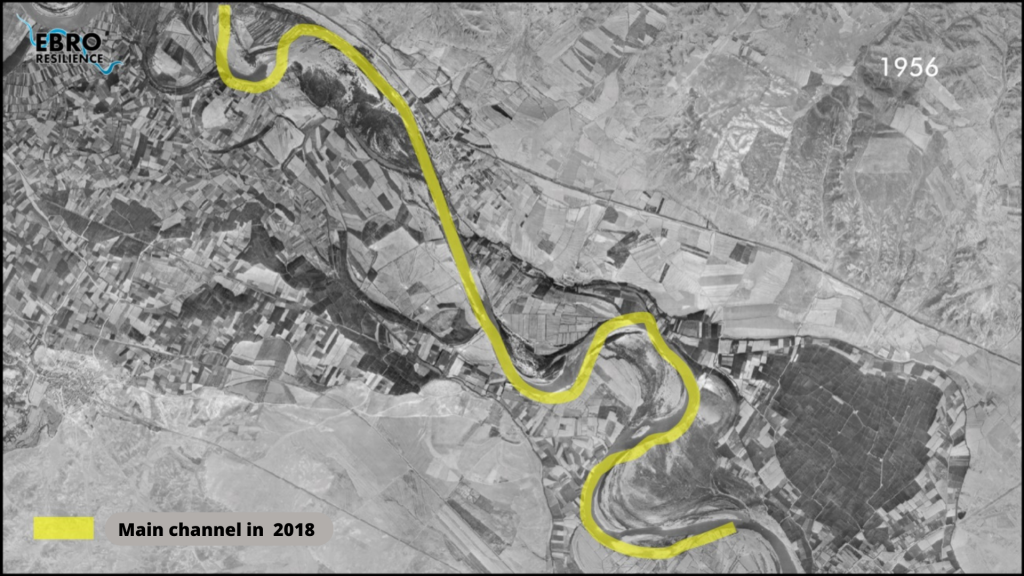
The hydraulic behavior of the river is conditioned by the morphology4 of its course, which changes from a meandering to a straight section and returns to another meandering section5. In this process, the river crashes against the upper terrace where Osera de Ebro is located, on the left bank. In these cases, the rivers are usually wedged against the terrace, as it is a harder obstacle and the friction decreases, they increase their velocity and, in the process, deepen. Analyzing the available historical aerial photographs (Figure 5a and 5b) and comparing the main channel of the river at those dates with the current one, it can be observed, in terms of its morphology, that, from the town of Osera upstream, the channel has lost several of its meanders, successively increasing the length of the straight section, in a process that is probably still active.
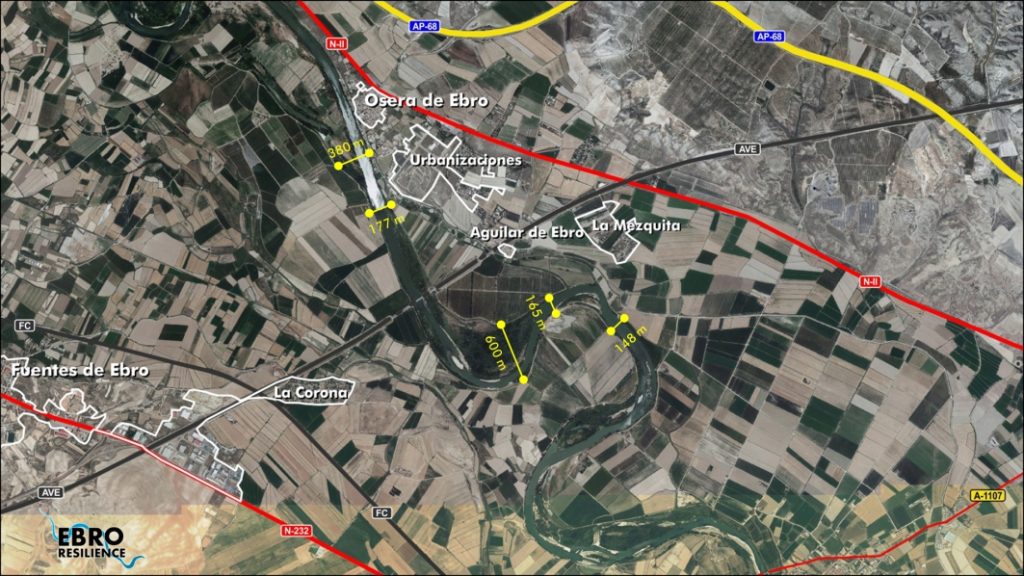
In addition to the above, the loss of these meanders has shortened the length of the riverbed by approximately 300 meters. By decreasing its course, the water loses friction, increasing the flow speed and its erosion capacity, favoring the deepening process of the bed.
Both phenomena described, the wedging along the terrace and the shortening of the channel due to the loss of the meanders, seem to have originated naturally. However, the subsequent channelization of the channel enhances the phenomena described by increasing the height of the water circulating in the channelized space.
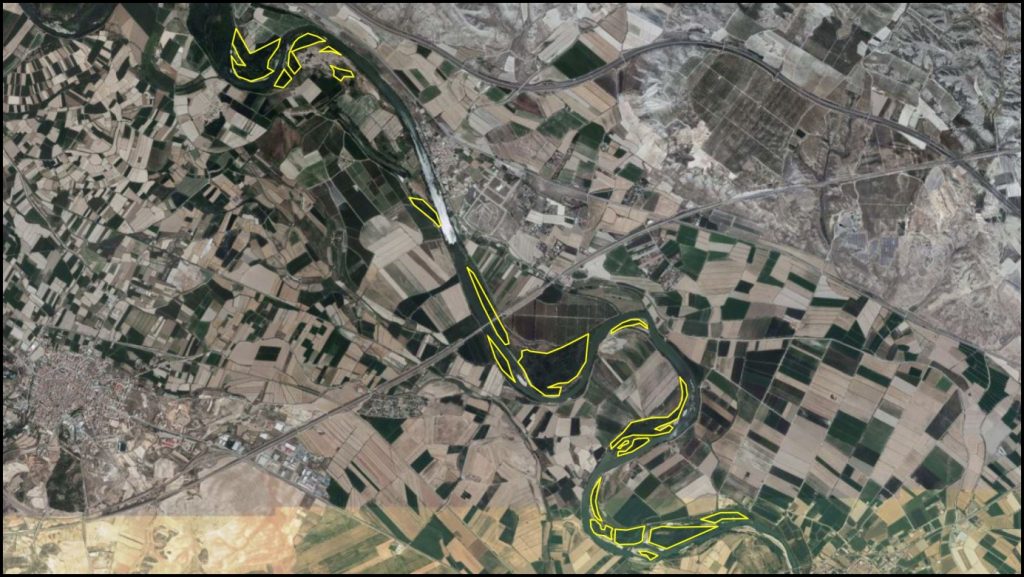
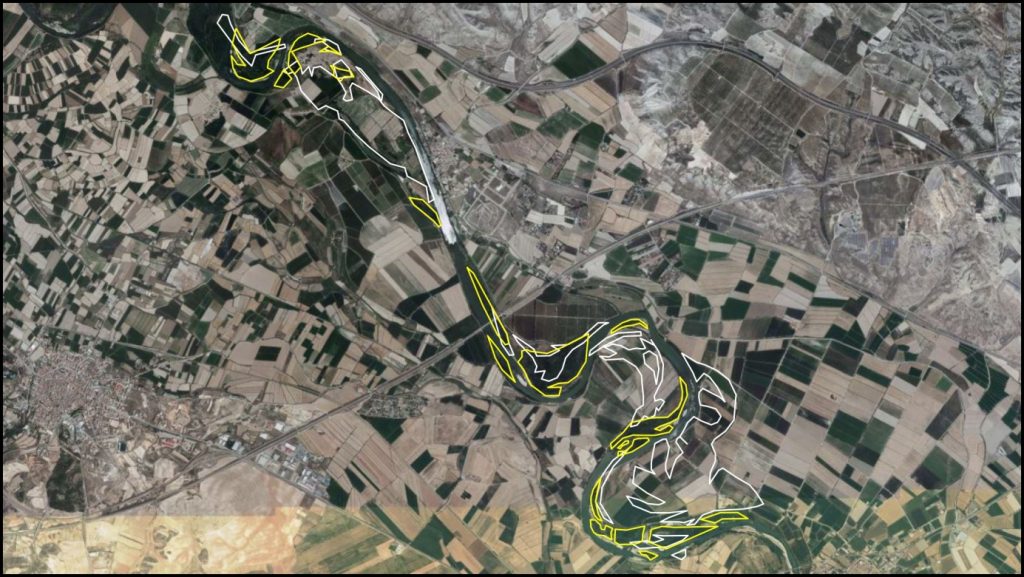
The effects of this process are visible in the Aguilar meander. The accelerated water must slow down to travel the perimeter of the meander. El aumento de la velocidad de las aguas que llegan al meandro y con ello su energía ha inducido un proceso erosivo en la orilla que se opone frontalmente a la corriente, de forma que el cuello del meandro ha visto disminuida su anchura a la mitad. In turn, the perimeter of the lobe has increased to absorb this excess energy (Figure 6).
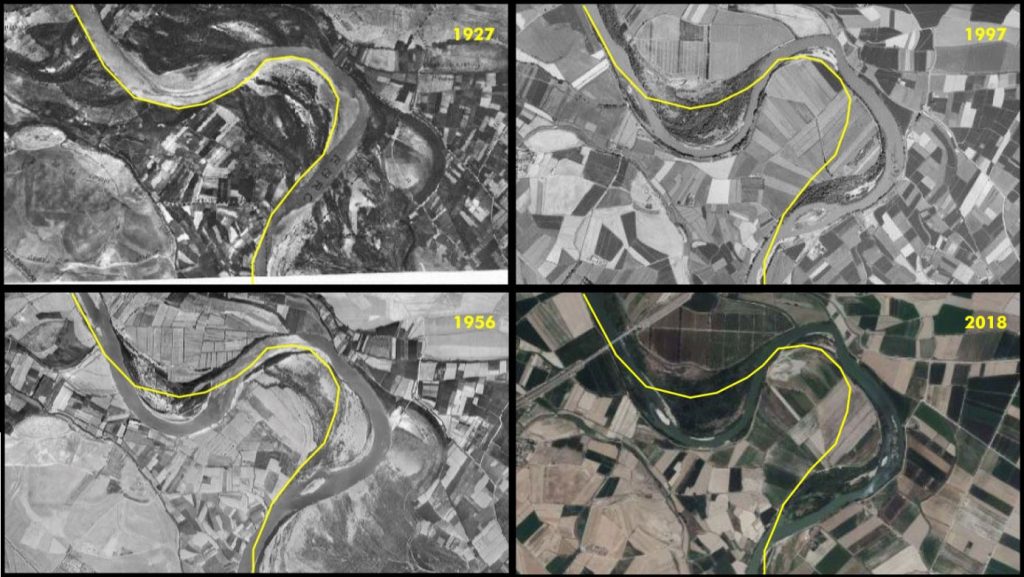
The usual reinforced riprap defense6 that is built in the eroding area increases the speed of water flow and does not absorb the energy of the impact, transferring the problem downstream.
Evolution of the vegetation area
In recent years, the territory has expressed great concern about the evolution of the vegetation located in the canalized area. In their opinion, the increase in vegetation that the riverbed has suffered due to the implementation of various environmental protection measures (Natura 2000 Network, Management Plan for the Natural Resources of the Sotos y Galachos del Ebro and the Reserva Natural Dirigida de los Sotos y Galachos del Ebro) is an obstacle to water flow and causes overflows.
To study the evolution that this element has undergone, the large masses of existing vegetation have been mapped in three temporal phases: 1956 with the section without channeling and the river without regulation (figure 7); 1997 with the river already channeled and regulated but without the entry into force of the environmental protection figures (figure 8); and 2018, which reflects the current state in which the effects of the environmental protection figures can already be seen (figure 9). In this mapping, the vegetation on the defense dikes has been excluded, since it is generally made up of two or three rows of trees.
A comparison of the situations studied shows that in 1956 the vegetated area was larger than at present (Figure 10), since large areas currently under cultivation, such as the Osera woodland or the Deslinde meander, were occupied by riparian vegetation.
In the comparison between 1997 and the present (Figure 11), which may reflect more clearly the evolution of the vegetation in recent years, the vegetated areas are significantly similar. It is observed that in some areas it has decreased while in others it has increased.
In conclusion, the vegetation in the section has evolved, but it does not seem that there is more vegetated surface than in the past, with the territory already configured in its current morphology. During the field visits, an “intensive” maturation of the existing vegetation has been observed, which can lead to a visual increase in vegetation.
Objectives of the study
In accordance with the Ebro Resilience Strategy, the specific objectives of the study were as follows:
- Evaluate the level of protection of the urban areas of Osera de Ebro, Aguilar de Ebro and Fuentes de Ebro for floods with a return period of 25 years.
- Propose actions to prevent flooding, in the event of flooding.
- To reduce the risk of flooding in non-urban areas, mainly by reducing the speed at which water flows and/or the height that floods reach over fields.
Work performed
For the preparation of the study, a series of technical studies have been carried out using the latest available technologies, which have made it possible to evaluate the current situation of the section with respect to the objectives set. Once the current situation has been evaluated, different alternatives for action have been studied, individually and in combination, selecting those that have produced the desired effects and discarding those that are less favorable or counterproductive.
Digital Terrain Model (DTM)
To begin the study, a digital terrain model7 (called DTM) is made to reproduce the current situation. It is important that this DTM faithfully reproduces the conditioning factors of the river section under analysis, and for this purpose the work listed below has been carried out.
First, the terrain is reproduced on a large scale, using LIDAR8 topography, which consists of a scan of the terrain using aerial means (normally a light aircraft is used for large areas, but drones are commonly used).
Next, the topography of the most important elements for the study is obtained, such as: the crest of the dikes, walls, breakwaters, bridges, drains, relief channels, safety perimeters, etc. This work has been carried out using classical surveying methods, increasing the accuracy of the data on these key elements.
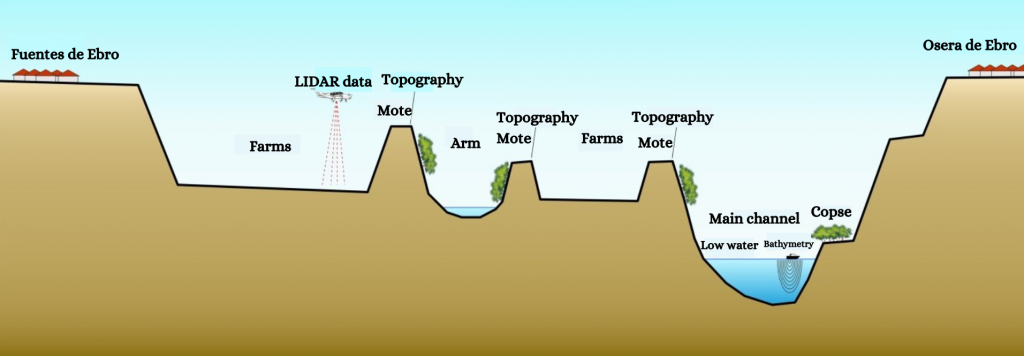
The above methods have the disadvantage that they are not able to obtain data from the ground beneath the water. This has been the main drawback encountered in previous flood studies. Technology is now available to obtain the topography of the river bed in a continuous manner. As a novelty for these studies carried out within the framework of the Ebro Resilience Strategy, aquatic means equipped with sonar9 have been used to collect bathymetric data10 from the bed of the riverbed, incorporating these data into the study.
The data obtained are combined for the elaboration of the digital terrain model.
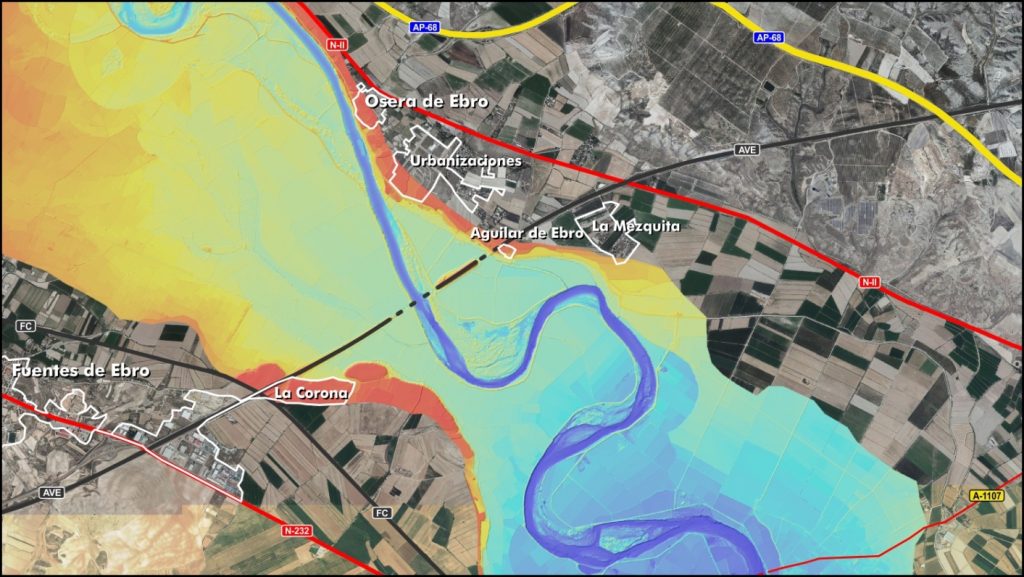
The DTM analysis has corroborated that, in the case of urban areas, these are located on the upper terraces of the river (in reddish color in Figure 13).
On the other hand, the bathymetry has confirmed the erosive processes in the bed of the channel that were deduced from the morphological analysis carried out.
Hydraulic model
The next step of the study is the analysis of flooding episodes. Hydraulic models are used for this work, which consist of a computer tool that applies a given flow rate to the DTM and reproduces the effects of flooding11.
These computer tools require a process called calibration to adjust the results obtained to the characteristics of the section under study. In this case, the aerial photos of the avenue from April 2018 and December 2019 were used, achieving a good calibration.
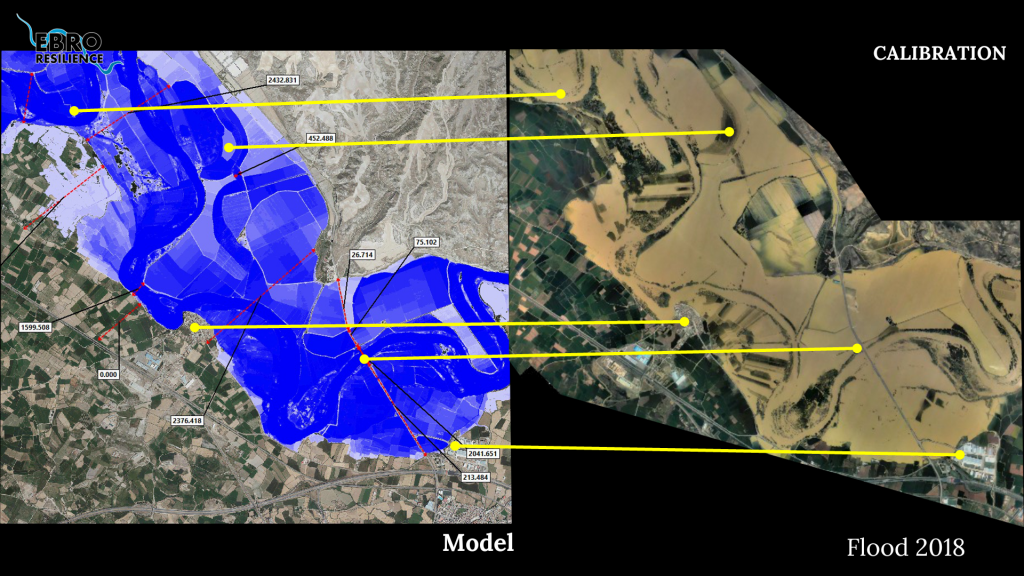
Once the hydraulic model has been configured and calibrated, the target flood is reproduced, in this case the one corresponding to a return period of 25 years, which in this section is equivalent to a flow of 2,800 m3/s, and the effects produced on urban areas are analyzed.
With respect to the problems that may be caused by possible overflows, it should be borne in mind that the hydraulic model considers the terrain to be rigid, i.e., the motes do not collapse at any time even if they are overflowed. To compensate for this circumstance, the flood peak in the simulation will be prolonged in time, achieving effects similar to those produced in a real event.
Study of alternatives
The analysis of the simulation of the target flood for a return period of 25 years (2,800 m3/s in this section) shows that none of the urban areas of the section are affected (Figure 15). The mapping of the National Flood Zone System has shown that even for floods with a return period of up to 500 years, urban areas would be protected.
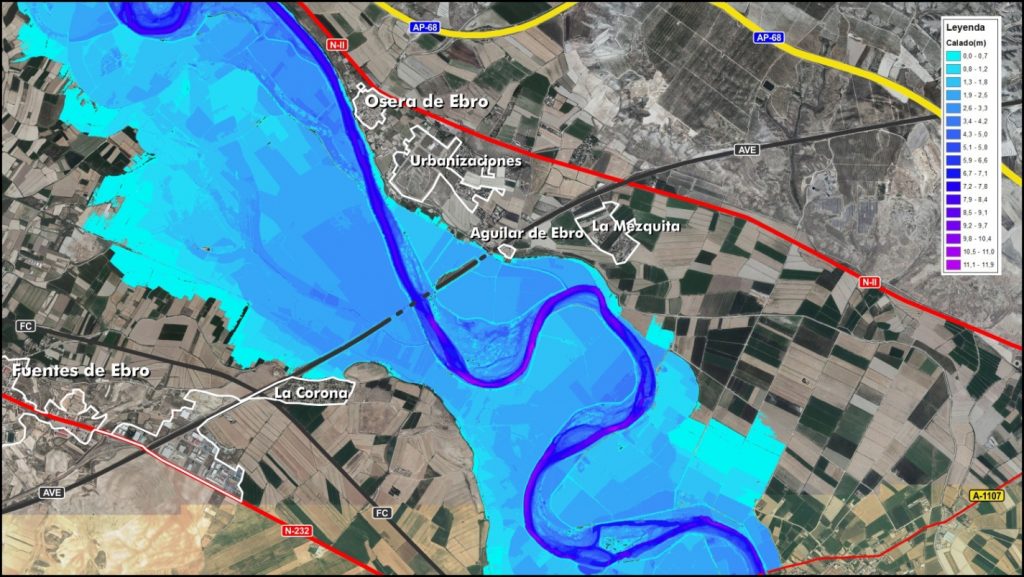
Consequently, it is necessary to continue the analysis for the next objective, which will consist of studying alternatives to reduce the risk of flooding in non-urban areas, mainly by reducing the speed of water circulation and/or the height of flooding over the fields. In this case, the study flow corresponds to a return period of 10 years and a flow rate of 2,300 m3/s.
For this purpose, and with the objective of obtaining two extreme comparative analyses, an initial modeling was carried out in which the hydraulic model was shaped so that all the existing vegetation in the section would be removed and replaced by bare gravel beds. The aim was to test the effectiveness that the reduction of the existing vegetation would have on the current flooding effects. Es decir, si esta medida fuera realmente eficaz aplicada localmente, la supresión completa de la vegetación debería mostrar una mejora sustancial en las condiciones de inundación a nivel de tramo.
The second alternative analyzed is a total removal of the existing motes on the right bank, the study area. Analogous to the previous alternative, if the removal of defenses at the local level would have positive effects on flood risk, a complete removal of defenses should show clear positive effects at the reach level.
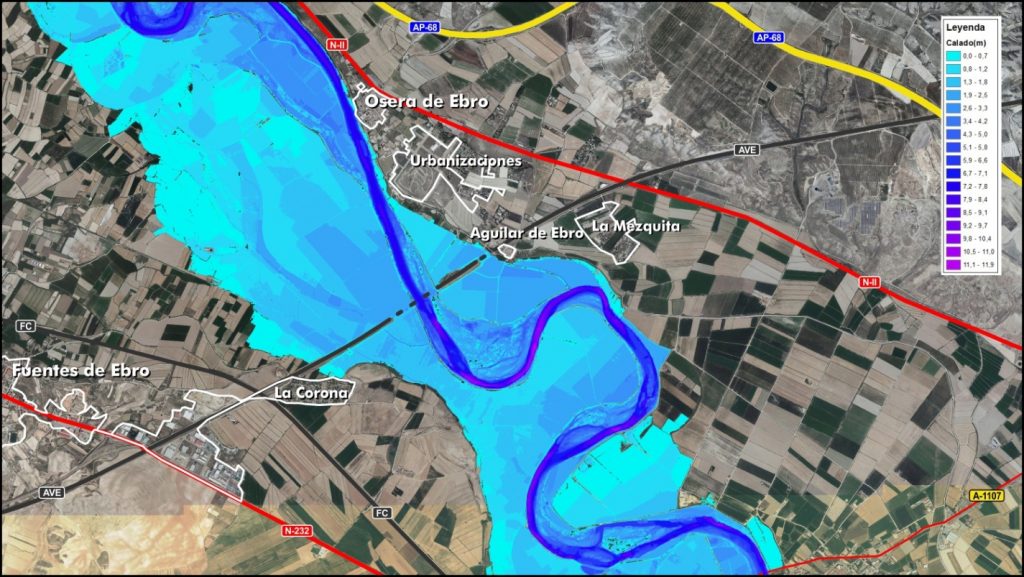
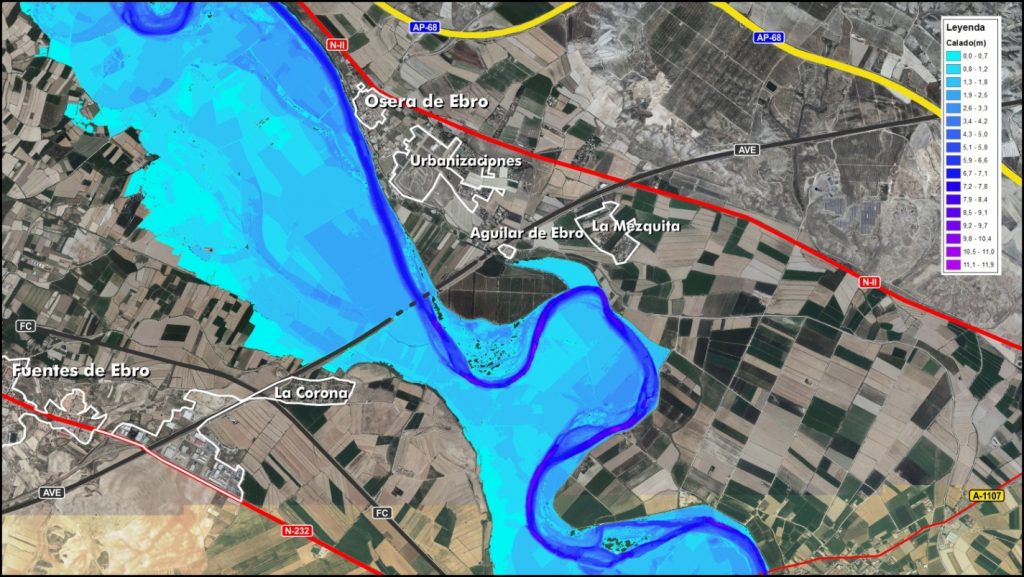
A comparison of the two solutions (Figure 16) shows few differences. Both solutions achieve a reduction in the height of the water over the farms, higher without defenses, but in the case of the suppression of vegetation no positive effects are achieved in terms of speed reduction and in the second alternative there is even an increase in the speed of flow over the fields.
Considering that it is not possible to avoid flooding of the cultivable area, it is necessary to study alternatives for adaptation and damage reduction.
The following assumptions have been followed for the approach of the adaptation alternative:
- Optimize the capacity of the main channel, so that it can operate at full section.
- Delay as much as possible the initial overflow, which occurs at the beginning of the stretch.
- Reduce the speed at which water flows over the fields, thus reducing the dragging of arable land and limiting erosion caused by waterfalls between terraces.
- To reduce damage to the irrigation system, which is caused to a greater extent by the burial of existing irrigation ditches with the dragged earth.
- Minimize the risk of breach of the defenses, both at the inlet and at the return to the channel.
- Allow efficient, rapid and damage-free drainage of accumulated water once the flood event is over.
- Limit random variables in the operation of the system, as well as the need for human intervention.
The objectives listed above can be summarized in one: THAT THE RETURN TO NORMALITY AFTER AN AVENIDA EPISODE CAN BE CARRIED OUT AS QUICKLY AND AT THE LOWEST POSSIBLE COST.
Description of the proposed alternative
In several areas similar to the one studied, it has been found that a controlled pre-flooding of the farms and with the water flowing downhill, that is, from the lower areas to the higher ones, creates a “cushion” of water that reduces the erosion generated by the passage of overflowing water.
At the same time, the existence of hydraulic pressure on the backside of the defenses stabilizes them and reduces the possibility of their rupture, even in the event of water overflowing over the dams.
On the other hand, the installation of elements that allow for effective drainage without breaching the defenses once the flow of water in the channel decreases, would allow for a quicker return to normal activity.
The current constrictions in the canalization must be corrected to avoid premature overflows in uncontrolled areas that could ruin the behavior of the system, generating uncontrolled breaks in the defenses.
In addition to the above, the irrigation system should be adapted to reduce the damage caused by circulating water, by burying the irrigation ditches, using siphons or installing elements that limit the effects of water jumping on them.
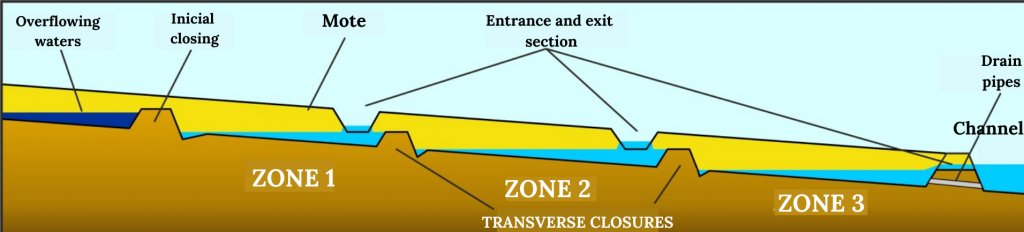
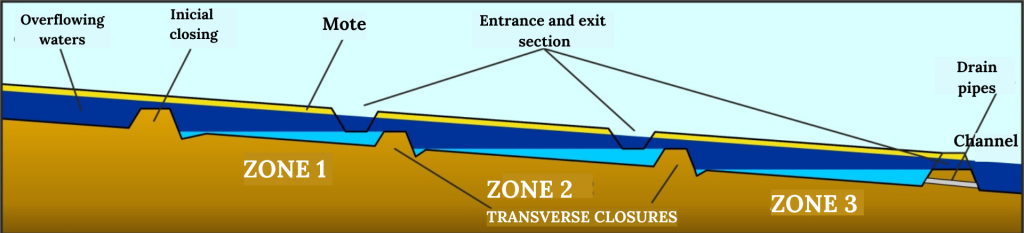
Considering these five issues, it is proposed to implement elements that allow a controlled pre-flooding of the cultivable area in compartments adapted to this circumstance and which have been called lateral flow buffer zones. The implementation of these zones must be accompanied by the construction of a closure cordon at the original point where the overflow begins, in order to control the flows that determine the entry of water.
The operating scheme would be as follows (Figure 17):
- The initial closure cordon will serve to limit the premature entry of water and will be adapted to the passage of the current over its crest.
- Between each buffer zone, a road will be constructed as a transverse closure at a low height that will control the filling level of each buffer zone. This closure will be prepared to support the passage of water and will direct it to the determined areas.
- Each buffer zone will have a lowered section in the defense mote that will facilitate the entry of water at the determined level during the filling process and the exit of water at the surface during the emptying process. They will also be equipped with drainage pipes to evacuate the water accumulated in the lower areas. These pipes will be equipped with flap valves to prevent water from entering the farm from the river.
- The irrigation system must be adapted to the operation of the buffer zones.
- The existing constrictions in the canalization in front of the Osera de Ebro housing developments and in the lobe of the Aguilar meander will be corrected. For this purpose, the existing narrow zone defense will be removed and a setback will be built to provide the main channel with sufficient width.
- During the passage of a flood, the buffer zones will have a cushion of water that will reduce erosion and dragging on the farms (Figure 18).
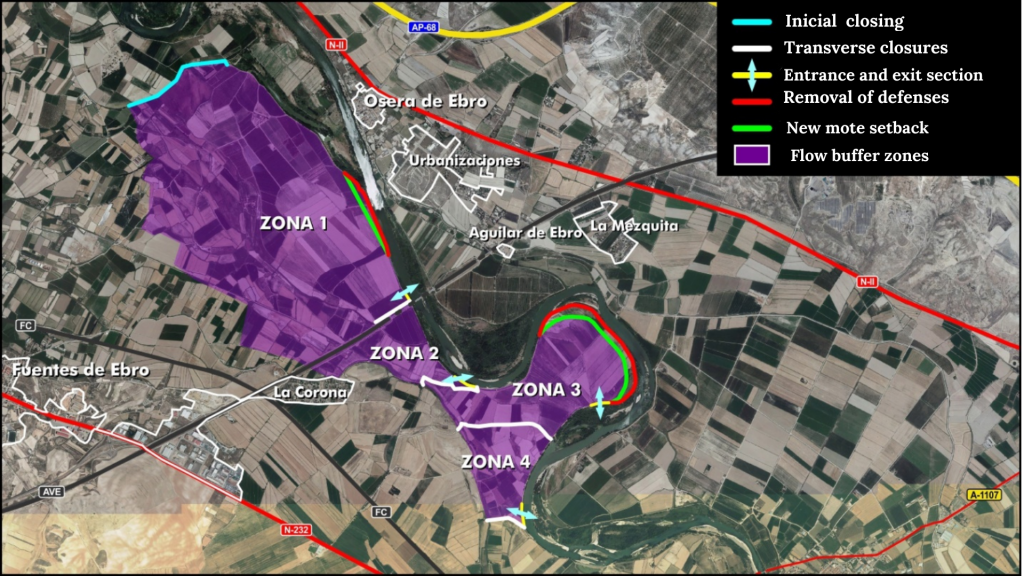
A series of preliminary design tests have been carried out to check the possibility of implementing the solution described in the study section, verifying its feasibility and the reduction in traffic speed that would be achieved. Figure 19 shows the final modeled score, consisting of four damping zones, of which 2 and 4 already have adequate behavior. The final zoning of the margin and the layout and design of the elements that will allow its correct functioning must be carried out during the drafting of the construction project.
The effects achieved after this first scoring are as follows:
- The capacity of the main channel has been optimized; in the narrowest areas, the flow rate increases by more than 200 m3/s.
- The initial overflow is delayed, from around 1,600 m3/s to 1,800 m3/s.
- In the tighter buffer zones after this first test, there is a generalized decrease in the velocity of water flow over the fields.
- The proposed adaptation of the irrigation system will reduce the burial of irrigation ditches.
- The defenses are more stable, balancing the thrust of the waters on both sides of the defenses.
- The installation of the outlet sections plus the drainage pipes will allow for efficient, rapid and damage-free drainage of the accumulated water once the flood event is over.
- Random variables in the operation of the system are limited, which has a positive impact on the safety of the downstream town of Pina de Ebro.
Conclusion
The urban areas present in the section are not affected by floods with a return period of 25 years, achieving the objectives set out in the Ebro Resilience Strategy.
Taking into account that the overflow on the right bank cannot be avoided, adaptation measures are proposed to reduce damage in the non-urban area. In this case, the proposal is the implementation of lateral flow buffer zones.
What’s next?
The urban areas present in the section are not affected by floods with a return period of 25 years, achieving the objectives set out in the Ebro Resilience Strategy.
Taking into account that the overflow on the right bank cannot be avoided, adaptation measures are proposed to reduce damage in the non-urban area. In this case, the proposal made is the implementation of lateral flow buffer zones.
1 Shapedby the passage of a river
2 Theeffect or paradox of the levee occurs when these structures are overtopped by the overflowing waters and prevent the waters from returning to the main channel, obtaining the opposite result to that intended.
3 Healthnot exposed to water.
4 Shapesadopted by the watercourse.
5 Morphologyof a watercourse in which the river flows through meanders in succession.
6 Structuremade up of large stone blocks.
7 Theequivalent of a terrain model but in a digital environment
8 An acronymfor Light Detection and Ranging or Laser Imaging Detection and Ranging.
9 Elementthat obtains the depth of the bottom of the sea or a river by emitting sounds and measuring their reflection.
10 Topographymade underwater.
11Theequivalent of pouring water into the model.